The Perfect Line
I didn’t want to write this blog.
AIStore performance and scale-out story dates back to at least 2020, when we first presented our work at the IEEE Big Data Conference (arxiv:2001.01858). The linear scalability story was told and re-told, and the point was made. And so I really did not want to talk about it any longer.
But something has changed with our latest v3.30 benchmarks on a 16-node OCI cluster:
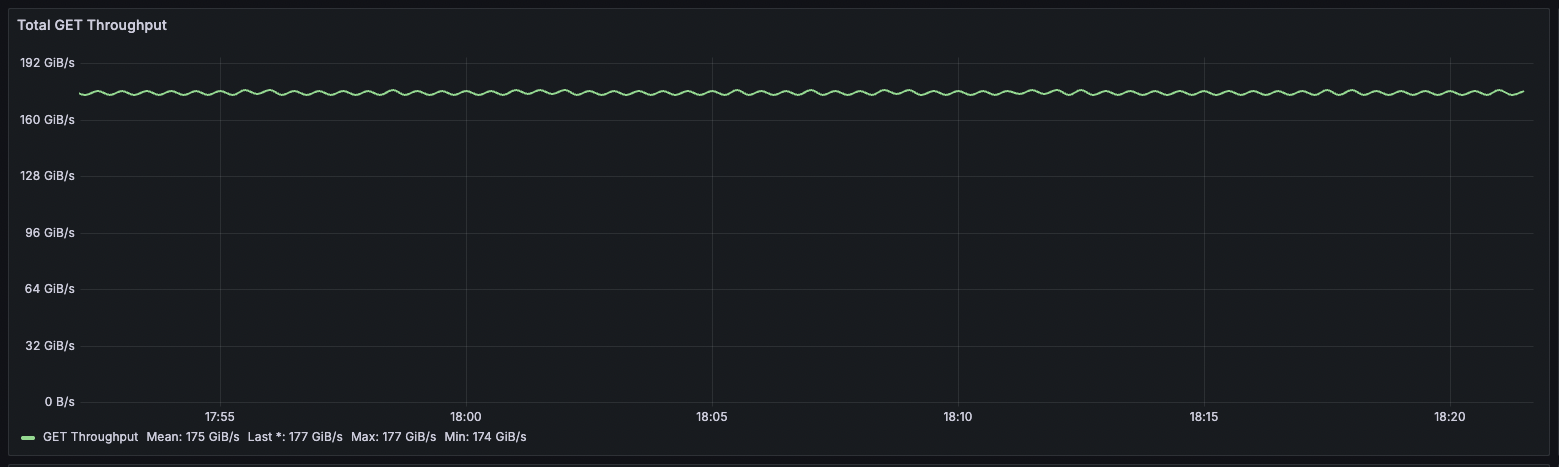 Fig. 1. Aggregated cluster throughput.
That’s a 100% random read workload at 10MiB transfer size from an 87TB dataset, with 1536 GB RAM on each storage node (ensuring the data is served from disks).
$ ais ls ais://ais-bench-10mb --summary
NAME                     PRESENT     OBJECTS     SIZE (apparent, objects, remote)    USAGE(%)
ais://ais-bench-10mb     yes         8421329 0   80.31TiB 80.31TiB 0B                7%
The Theoretical Limit
When we talk about the raw power of our 16-node cluster, each equipped with a 100Gbps NIC, the numbers are impressive: 186 GiB/s.
Quick math. Per‑node link speed: 100Gbps = 12.5 GB/s ≈ 11.64 GiB/s. Cluster aggregate (16 nodes): 11.64 GiB/s × 16 ≈ 186 GiB/s
This is the sheer, unadulterated, theoretical maximum aggregate throughput if every single bit could fly across the network without any processing, any protocol, or any pause. It represents the absolute ceiling of what the hardware could theoretically achieve assuming all those circumstances.
However, in the real world, data doesn’t just teleport. It needs to be packaged, routed, error-checked, and processed by the operating system and applications. This is where the networking stack overhead comes into play. Think of it like the ‘friction’ or ‘tax’ on the raw bandwidth.
This overhead isn’t just one thing; it’s a stack of small but measurable costs:
- L3/L4 protocol headers: IPv4 + TCP add a minimum of 40B (52B with common SACK/TSopt options). Maybe the least expense, especially at Jumbo frames and also because LRO/GRO reduce the number of packet headers the host sees (by coalescing them).
- TLS handshake, TLS 5-byte headers, and TLS encryption (if HTTPS is used).
- Memory copies: the default TCP path copies payload once into kernel space and once via DMA.
- Context‑switch overhead (syscalls + IRQs).
More about context switching: consider read-only HTTP traffic (no
sendfile) whereby the server (like AIStore) is transmitting large payloads — large enough to utilize reusable 128K buffers. In other words, Tx path and a standardio.CopyBufferat 128 KiB chunks. Each iteration performs two syscalls –read(2)on the local XFS file andwrite(2)on the socket – and therefore 4 (four) context switches (user => kernel and back for each call). Unlikesendfile(2), this path touches userland twice: kernel => Go slice onread(), then Go slice => kernel onwrite(). At full network speed, that adds another ~23 GiB/s of DRAM traffic.
Long story short, the actual achievable throughput is always lower due to various networking (and non-networking) overheads. The realistic percentage, bounded of course by the physical link, is highly contingent on the entire software stack and underlying infrastructure.
Industry sources typically cite 85-95% range as the realistic maximum efficiency for high-speed Ethernet. Generally, 85% is considered very good while 95% is exceptional to the point of being almost unachievable.
95%
The observed performance is what ultimately prompted me reconsider the blog. As the monitoring graphs clearly show, our AIStore v3.30 cluster consistently achieves a sustained GET throughput with a mean of 175 GiB/s, frequently hitting peaks of 177 GiB/s for extended periods.
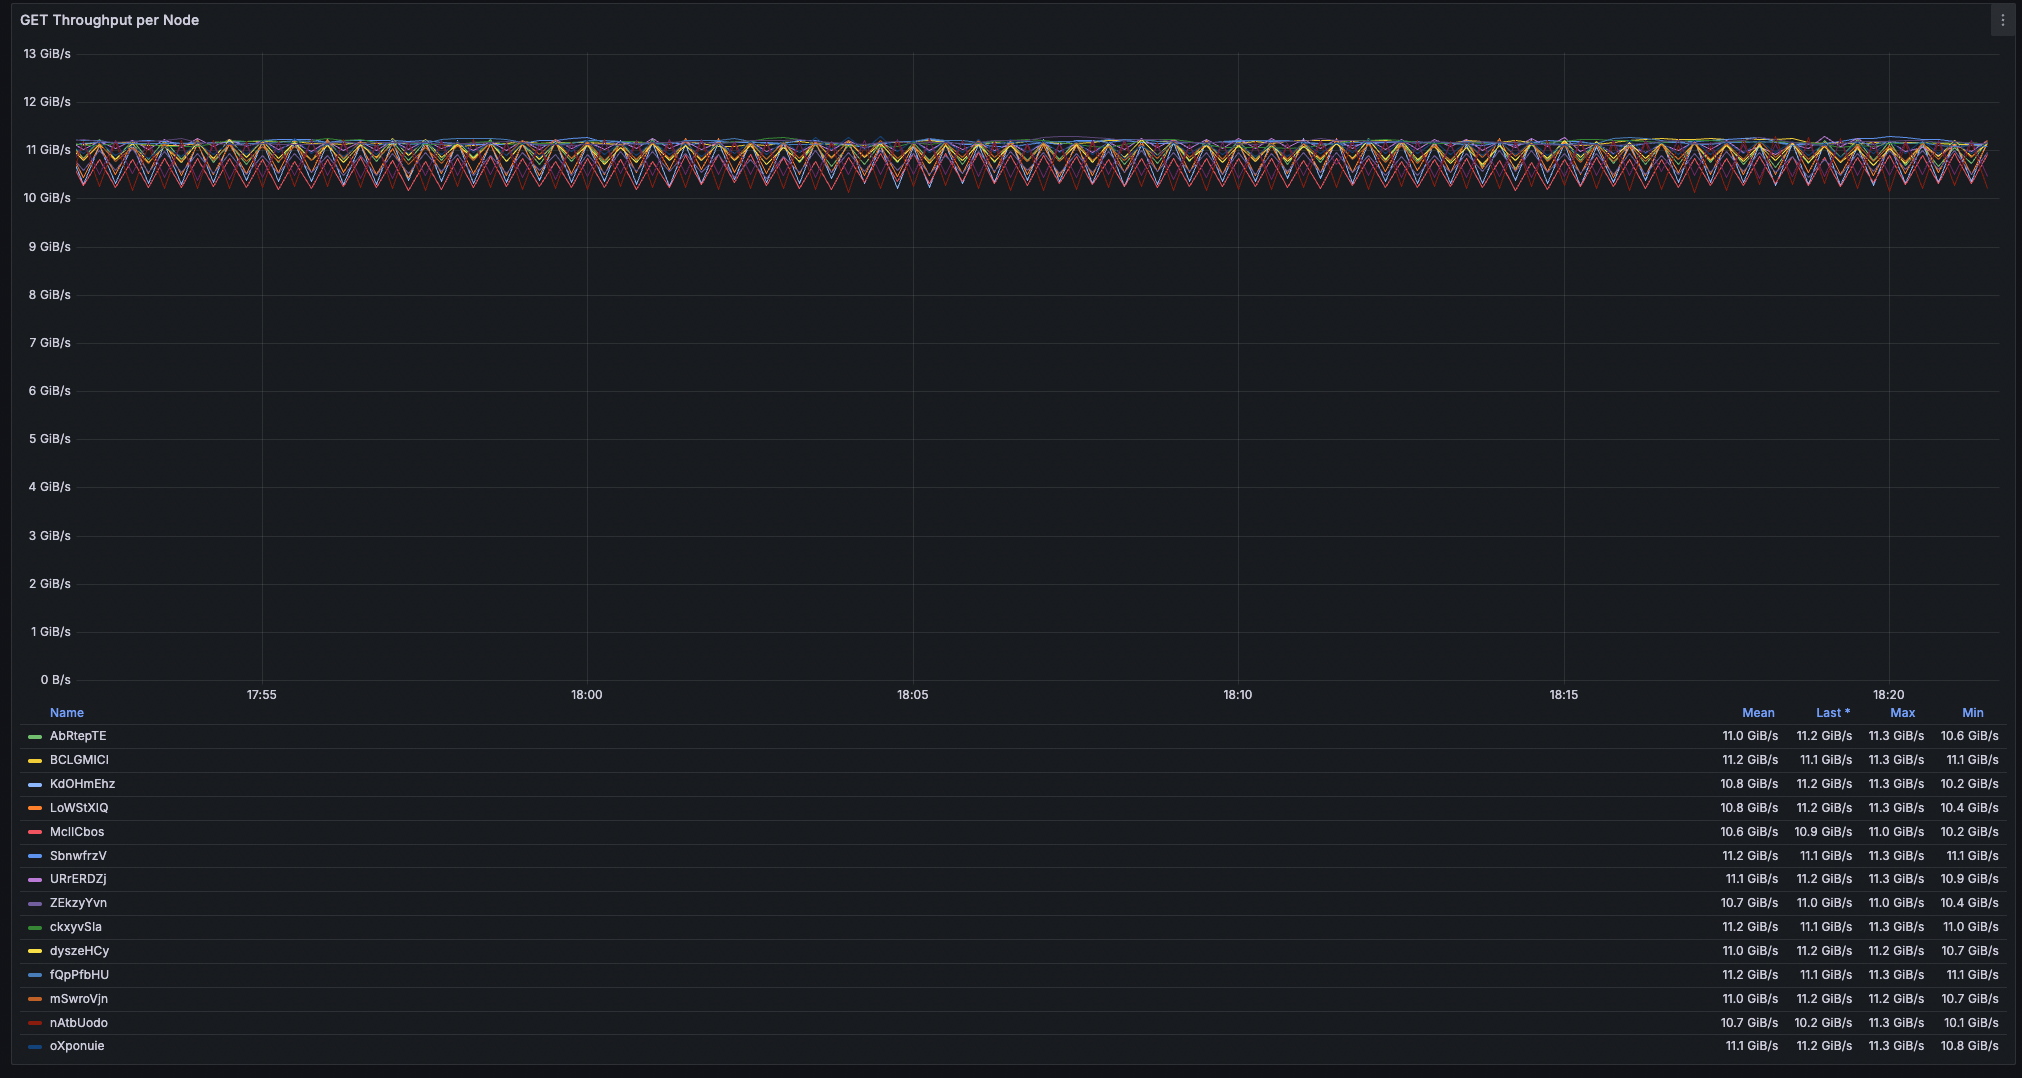 Fig. 2. Node throughput (16 nodes).
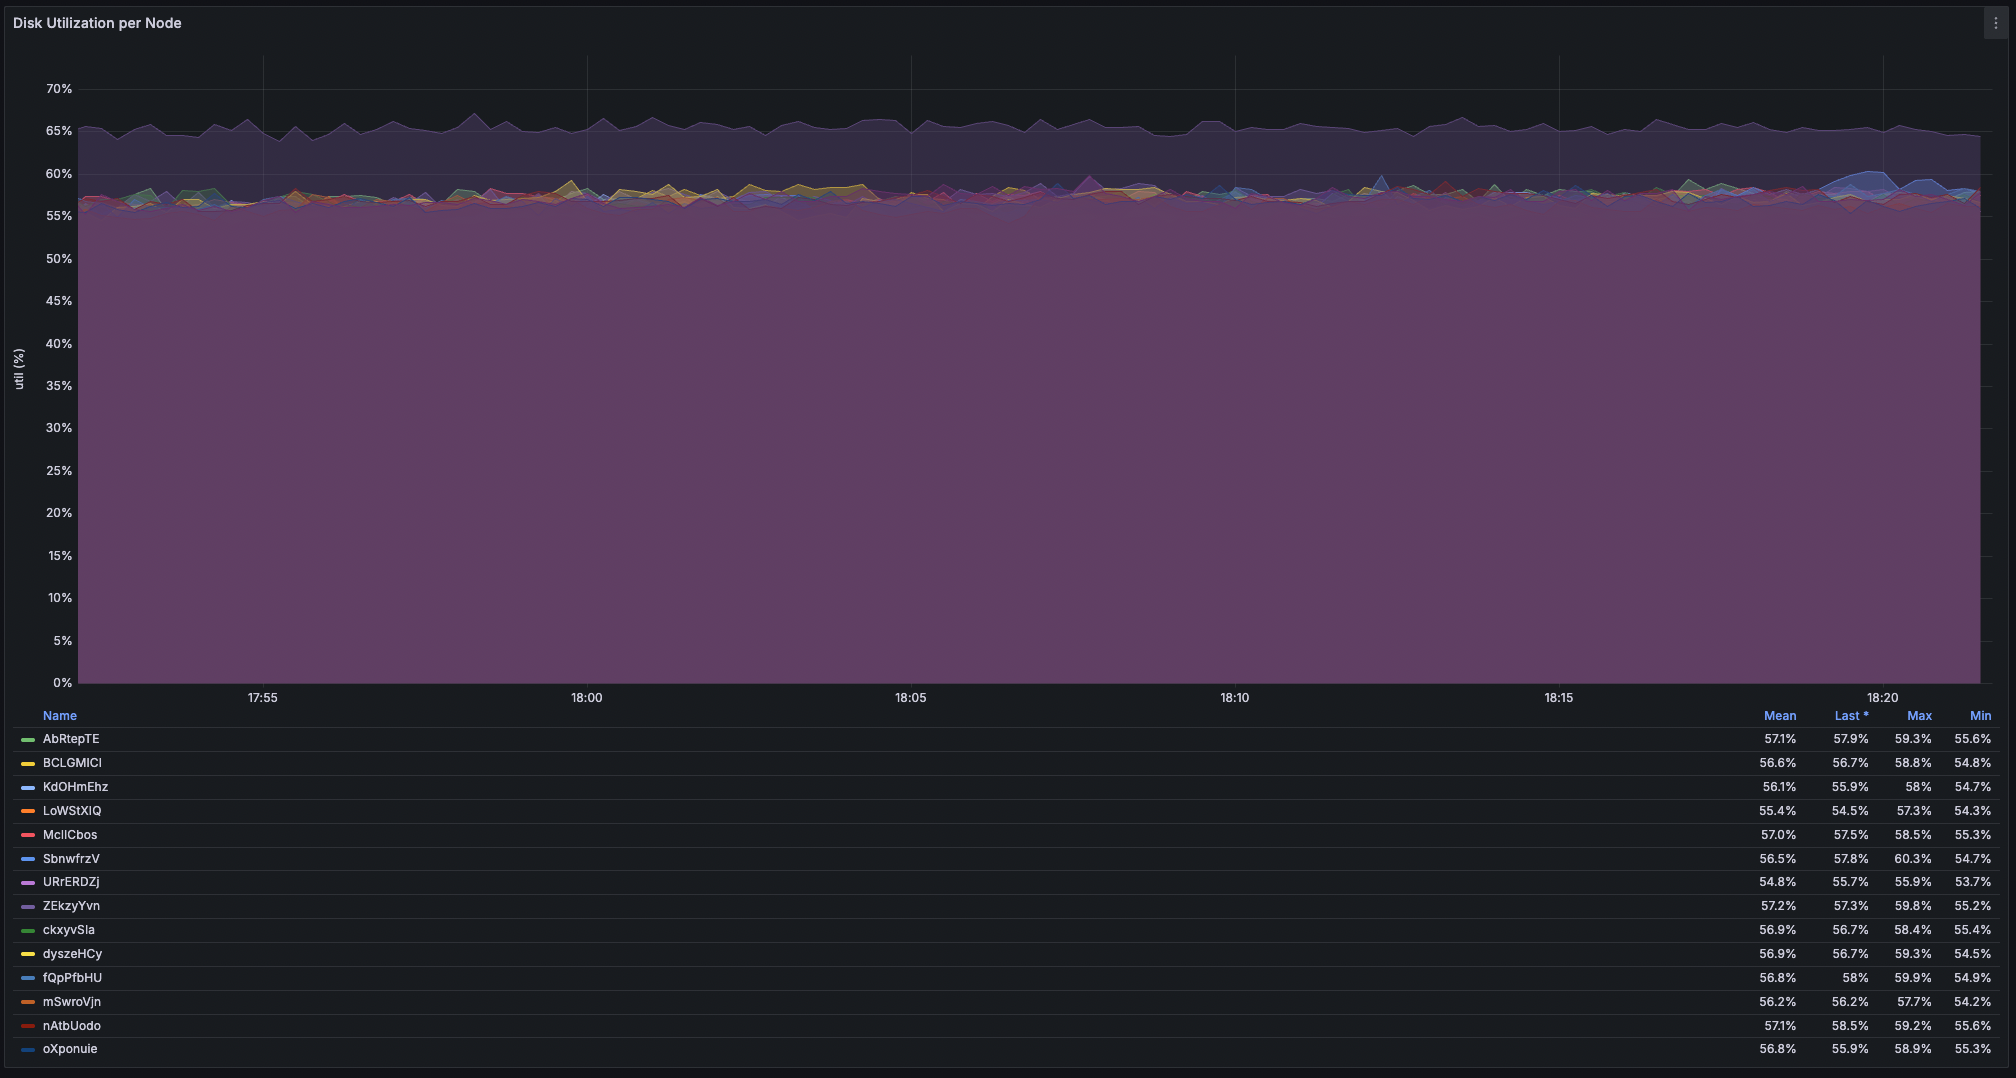 Fig. 3. Disk (min, avg, max) utilizations (16 nodes).
As a side, disk utilization may serve as an indication for OCI to maybe consider adding another 100G port.
This means we are effectively operating at 95% of the theoretical maximum raw network capacity — exceeding what most industry sources consider the practical ceiling. But the numbers tell only part of the story. What really stands out is the consistency:
- Time variance: under 2% during sustained runs
- Node variance: under 3% spread across all 16 nodes
- Disk utilization: a rock-steady 55–57% across all 192 NVMe drives
- Workload distribution: each node contributing roughly 11 GiB/s
In short, the graphs show something you rarely encounter in practice: a distributed system operating at the physical limits of the underlying infrastructure.
Not bad for a “boring” benchmark that’s just a straight line.